How to test whether it’s worth using data URIs (e.g. base64) for image assets in (S)CSS?
Background
Making a few economies in the code we create and distribute is beneficial to everyone. The larger the scale of the project, the more important these economies are.
For the humble front end developer, principally involved in HTML/CSS, networks timelines, browser painting, HARS and the like can seem completely baffling. This post provides a simple how-to for performance testing one tiny part of SCSS/CSS – whether to use Data URIs for image assets or not.
What is Data URI encoding?
Data URI encoding is the process of converting image assets and the like into code that is embedded directly in the HTML/CSS document. The thinking behind encoding small images in this manner is that it negates a separate HTTP request (e.g. browser requires a number of images so asks the server for each in turn, with each requiring a separate round-trip to and from server to browser) for each required asset. It should also be noted that using Data URIs aren’t limited to CSS, they can also be used directly in the HTML. Chris Coyier has a good explanation if you would like a little more info.
How to encode to Data URIs?
In practical terms, this means for small images that would ordinarily be referenced like this with Compass in the (s)css:
background-image: image-url('image.svg'); And become this in CSS:
background-image: url('../img/image.svg');Instead is referenced like this:
background-image: inline-image("image.svg");And results in CSS code like this (truncated for brevity):
background-image:url('data:image/svg+xml;base64,PD94bWwgdmVyc2lvbj0iMS4wIiBzdGFuZGFsb25lPSJubyI/Pg08IS0tIEdlbmVyYXRvcjogQWRvYmUgRmlyZXdvcmtzIENTNiwgRXhwb3J0IFNWRyBFeHRlbnNpb24gYnkgQWFyb24gQmVhbGwgKGh0dHA6Ly9maXJld29ya3MuYWJlYWxsLmNvbSkgLiBWZXJzaW9uOiAwLjYuMSAgLS0+DTwhRE9DVFlQRSBzdmcgUFVCTElDICItLy9XM0MvL0RURCBTVkcgMS4xLy9FTiIgImh0dHA6Ly93d3cudzMub3JnL0dyYXBoaWNzL1NWRy8xLjEvRFREL3N2ZzExLmR0ZCI+DTxzdmAs you would imagine you can’t use this technique in every situation. For example, <ie8 typically ‘pisses and moans’ and basically won’t work.
Why bother with Data URIs?
The principle aim of doing this is to reduce http requests. Less HTTP requests and possibly smaller KB size transferred ‘over the wire’
How to measure?
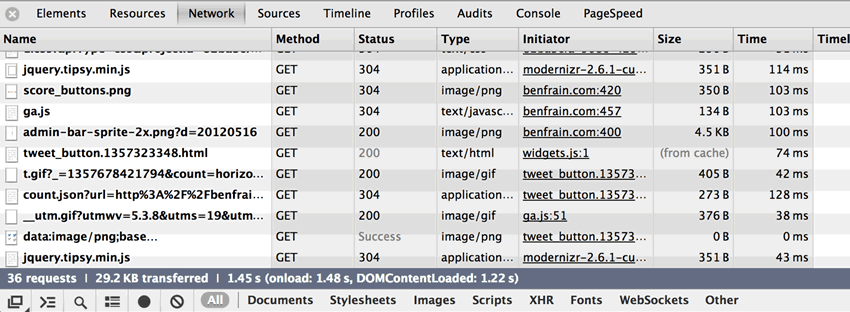
Chrome’s Developer tools has a Network tab which, when we visit a web page can tell us (amongst other things):
- what assets (img, JS, CSS) get loaded
- how many and how large those assets are (typically in KB)
- how long those assets took to load
Getting to the Network tab of Chrome
Every major browser has some version of this functionality but in Chrome, just right-click on a page and click ‘Inspect Element’ (or click Option/alt + command + I on the Mac). Then select the Network tab from the top. If you want more info on the Network panel and what it can do, checkout this article on the Chrome Dev Tool Docs.

The test
Here’s the simple test we will run. First of all, we’ll load all background images (there were around 20 SVG’s as background images when I ran the test, varying in size from 2KB to 14KB) from the CSS in the traditional manner, then run the same test using Data URIs instead of standard url’s and measure the difference between the two.
The test will be re-run three times each with a clear of the cache between each run to allow for differences in network performance (latency etc).
Step by Step (the ‘methodology’)
- Browse to the page to be tested
- Open Chrome Dev Tools
- Switch to Network tab
- In the Network area, right-click and choose ‘Clear Browser Cache’ (this is to prevent the browser using cached versions of any assets you may have already loaded)
- Refresh the browser window (‘Reload this page’ from the browser menu or ‘Command + R’ on the Mac)
- The page will reload, assets will populate the Network panel.
- Now look at the bottom of the Network panel window for the results.
Results
Traditional linking method
- 1st run: 25 requests, 112KB (amount of data transfered), 203 MS (time taken)
- 2nd run: 25 requests, 112KB (amount of data transfered), 183 MS (time taken)
- 3rd run: 25 requests, 112KB (amount of data transfered), 175 MS (time taken)
Data URIs method
- 1st run: 25 requests, 101KB (amount of data transfered), 166 MS (time taken)
- 2nd run: 25 requests, 101KB (amount of data transfered), 169 MS (time taken)
- 3rd run: 25 requests, 101KB (amount of data transfered), 173 MS (time taken)
Conclusion
The actual results produced here are of little relevance as they are particular to my own code. The takeaway is merely how to easily produce a simple test like this when you need to. There really is no hardship producing data URIs with Compass as opposed to just linking to assets and testing the pros and cons of each approach has been pretty simple.
Using the Chrome Dev Tools Network tab in this way allows us to make an informed performance decision based on empirical fact (specific to the project being worked on), rather than relying on guesswork. That’s obviously a good thing.
Update Nov 2013: what the tests don’t reveal is the cost for the browser in actually rendering the data URIs to the page (only the time it takes to download the assets) so ensure you consider a holistic approach to whether using a data URI in your CSS is appropriate.
Just showing my ignorance here, but generally are URIs smaller than their equivalent images in kb?
I realise it’s hard to generalise – but use the background images you mentioned as an example for size comparison purposes.
Or is this merely an excercise in reducing http requests?
Cheers
I