Test your Sass or CSS with the Chrome Developer Tools
This is the ‘text version’ of the presentation I gave at the 2013 CSS Summit. If you’d rather just look at the slides, here’s a direct link to them as a PDF.
Are you a whizz with the Chrome Developer tools? If you are, this post may not be that useful. Similarly, if you’re looking for help streamlining or troubleshooting your JavaScript you can move along. Nothing to see here.
Who this is for
This is aimed at users that are comfortable with writing HTML and CSS/Sass but would like to know about how Chrome Developer Tools can help them write more performant Sass/CSS or troubleshoot stylesheet problems. Before we look at the parts of the Developer Tools that can specifically help with CSS we will have a little orientation; covering some Dev Tool essentials. Then we’ll get into testing your CSS.
Here’s what we will cover in the Dev Tools Essentials section:
- Selecting elements with the magnifying glass
- How to move nodes
- Edit nodes (adding classes, editing IDs, deleting nodes, hiding nodes)
- Dock the Dev Tools left or right
- Viewing the hierarchy of nodes
- Styles panel – adding styles
- Viewing the computed style of an element
- Toggling the pseudo state (hover/active) on elements
Then here’s what we will cover with the Chrome Dev Tools in specific relation to Sass/CSS:
- Dealing with ‘Rule Rot’. How to find out which rules from your stylesheets are actually being used across the pages of a site. Useful if you need to remove old rules. Copy/paste into Excel.
- Find out if you are using any invalid CSS properties or values in your stylesheets.
- Find out how ‘performant’ your CSS is. Are any of CSS property/value pairs causing slow pages?
- Is your CSS inefficient. When you scroll and interact with your page, how much work are you causing for the browser?
- Cut out round-trips to the text editor. Link to post.
- Extra – configuring and using CSS Lint
Before we get into testing stylesheets with the Chrome Developer Tools, it’s important to know that every browser will be slightly different in how they interpret and apply CSS. Therefore, just because rules and pages are tested and perform well in Chrome, does not mean they will display similarly/faultlessly on other browsers.
However, doing some (any) testing of your CSS is better than none. Perhaps when you have got the bug for testing in Chrome, you can become familiar with the similar(ish) tools available in other browsers.
Chrome Dev Tool Essentials
If you’ve never used the Dev Tools, or use them infrequently, it’s probably worth reading this section. If you’re already pretty proficient with the Chrome Developer Tools, you can probably skip ahead.
Invoking the Developer Tools
To open the Chrome Dev Tools either right/cmd-click an element on the page and click ‘Inspect Element’ from the contextual menu or choose View, Developer, Developer Tools from the main Chrome menu (there’ll be a shortcut key combo listed there too).
Positioning the Chrome Dev Tools: bottom, right or floating
When the Developer Tools are active, you can click and hold the big grey header bar and drag it over to the right if you prefer them docked to the side (really handy for trouble shooting slimmer viewports when doing responsive web work). If you want them back at the bottom you can click and drag them back. Alternatively, you can switch Dev Tool positions by simply clicking and holding the view button bottom left:
Selecting elements on the page
You can choose the elements/nodes you want to inspect by either clicking on the relevant node in the Elements panel or clicking the magnifying glass at the bottom left area of the Developer Tools and then hovering the mouse over the area you want to inspect in the viewport.
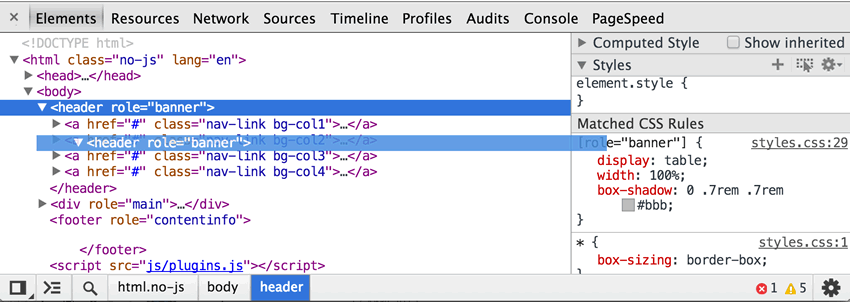
Expanding the DOM tree
Within the Element panel of the Dev Tools, for each node that contains other nodes a disclosure triangle can be clicked to disclose the contents of the selected node. Any ‘leaf’ of the node tree lacks a disclosure triangle, making it easy to know when you have reached the final node of a branch. A hierarchical path of the current selected node from the root is displayed at the bottom of the Dev Tools window.
How to move/edit/delete nodes
In the Chrome Dev Tools you can actually move, edit and delete nodes and see the results instantly in the browser window:
Move a node
To move a node, simply click and hold the disclosure triangle and then drag it somewhere else in the DOM:
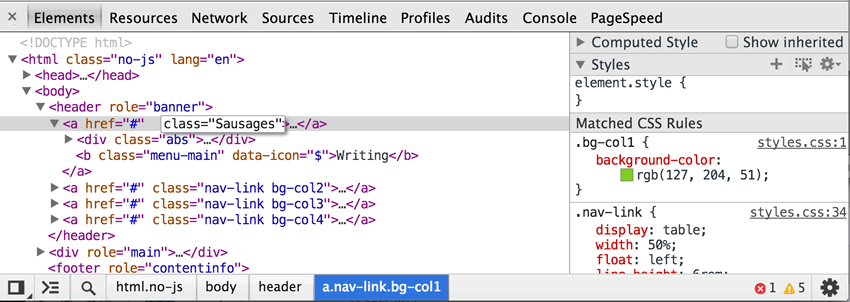
Edit a node
To edit a node, just double-click the attribute you want to edit, amend and then press Tab – the change will update instantly in the browser window.
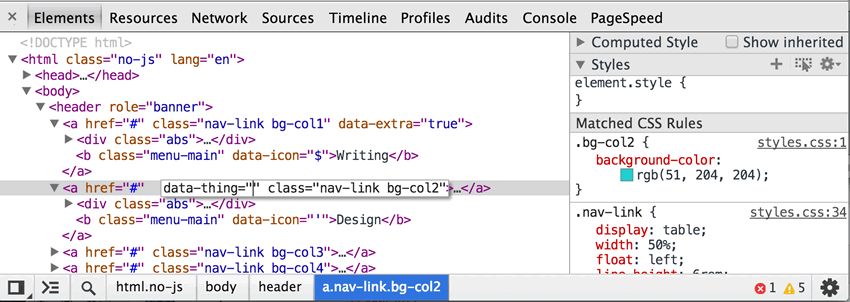
Add attributes to a node
If you want to add an attribute that wasn’t there already, just move before or after the attribute you clicked and add what you want:
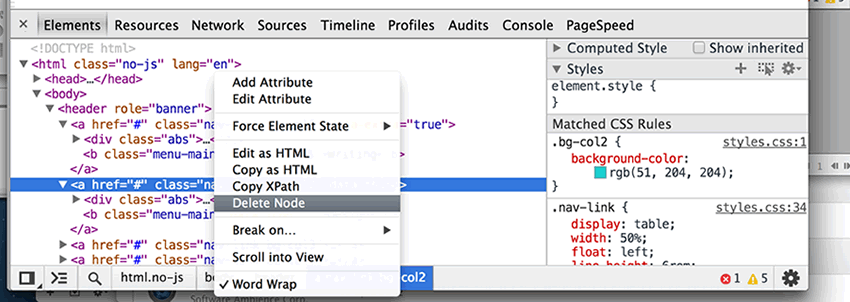
Delete a node
If you want to delete nodes, simply right-click on the relevant element in the tree and choose ‘Delete Node’ from the contextual menu:
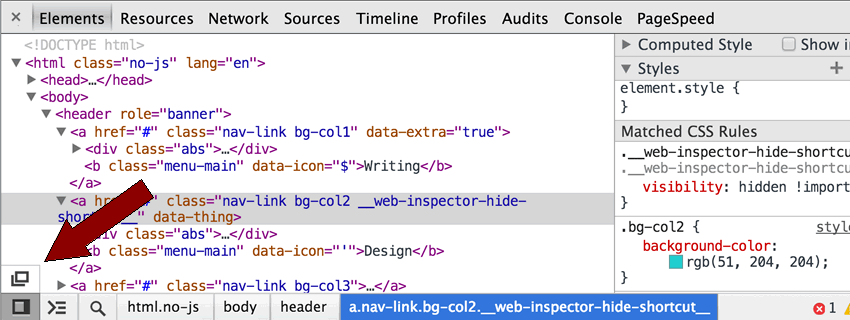
Toggle the visibility of a node
If you need to toggle the visibility of an element (note: toggling the visibility of an item is not equivalent to display: none; – it retains it’s physical space and just turns off any visible styles, we’ll see why this is useful shortly), with a node selected simply press ‘H’. You’ll notice this will add the class web-inspector-hide-shortcut to the element when active.
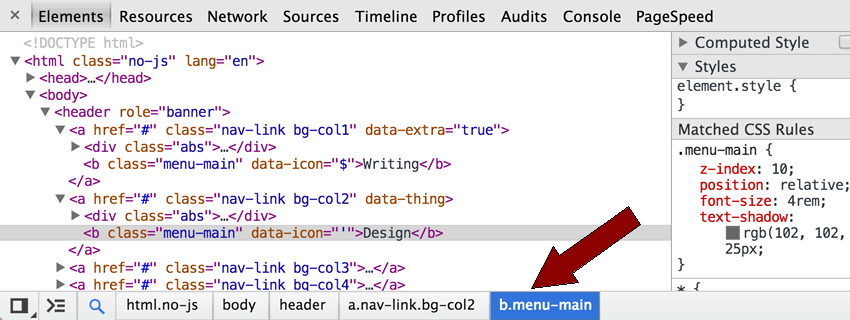
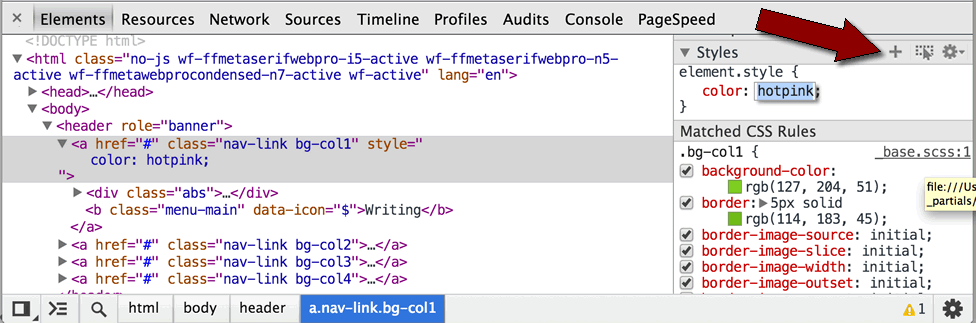
Using the styles panel
The styles panel is your direct access area to the CSS rules that are applied to the page. You can edit existing properties, add new ones and even save the values you amend directly back to the source Sass/CSS files.
Edit existing styles and adding new properties and values
With an element highlighted, the applied rules show in the styles panel:
‘Computed styles’ are what the browser is actually rendering to the browser window. This is useful for comparing what you think should be applied and what the browser is actually applying.
‘Styles’ contains a window to add an inline rule directly to the selected element.
To the side of the Styles header from left to right are some extra buttons:
The first is the ‘New Style Rule’ button. This allows you to add a new rule into a Web Inspector stylesheet (as opposed to inline on the element). Next is the toggle element states button (hover, active, visited and focus). Finally, a settings button to toggle how colour values are displayed (RGB/HEX/HSL).
The ‘Matched CSS Rules’ section includes rules from any stylesheets that are being applied to the selected element. Rules that are being overwritten via specificity have a line through. You can also switch individual properties on an off with the tick box to the side. Rules that have been commented out in the source Sass/CSS with a CSS comment show here but have a line through and are also unselected.
- You double-click to edit any value.
- Increment numeric values with the up and down keys (hold down shift to increment in 10s, hold down alt to increment in .1s).
- To add a new property to a rule, simply click to the right of the closing curly brace.
- Chrome will also auto-complete CSS property and value pairs – handy when you can’t remember the correct value.
Also note that in the Matched CSS Rules section, an indication of where the rule originated is given. Clicking this will open the source stylesheet file in the Sources tab of Dev Tools.

Essentials Section Summary
That was by no means an exhaustive list of the Element/Styles panel features of the Chrome Developer Tools but it covers enough for us to crack on with the Sass/CSS specific testing we need to do. Pull on your starched white lab coat.
Troubleshooting CSS (and Sass) with the Chrome Developer Tools
Chrome Release Channels
Chrome has a number of release ‘channels’: Stable, Beta, Dev and Canary.
– Stable is the version that normal ‘muggles’ get.
– Beta is slightly ahead of Stable in terms of the features it ships with but is quite stable.
– Dev contains more experimental features and enjoys more frequent updates but is still relatively stable.
– Canary on the other hand is the bleeding edge version that is full of the new dark arts stuff (between you and me, I heard a rumour that it’s built purely from hawcruxes and crow spit).
As it’s such a maverick, Canary will live happily alongside your other version (either Beta, Dev or Stable) of Chrome so it’s still worth keeping around.
You can download any of the various releases here: http://www.chromium.org/getting-involved/dev-channel
Dealing with ‘Rule Rot’.
Sadly Chrome has now removed the CSS selector profile feature which I feel is a great shame. I asked Paul Irish (Chrome Dev Team) via Twitter and he replied:
@benfrain it's gone! we wiped it out. doing more harm than good.
— Paul Irish (@paul_irish) August 28, 2013
I’ve left the info in here for posterity but be aware that it’s unlikely we will see the tool in this format again.
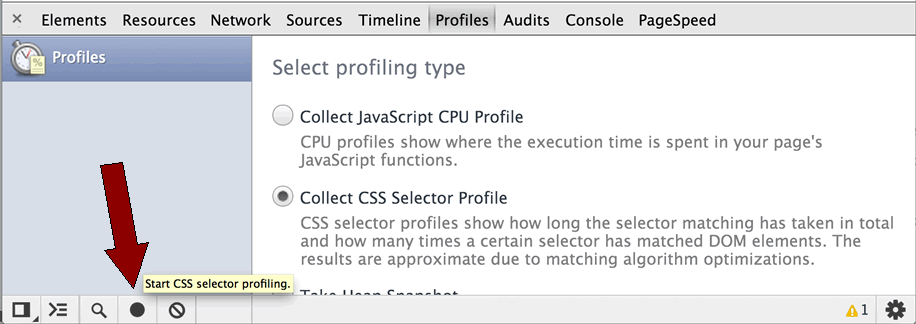
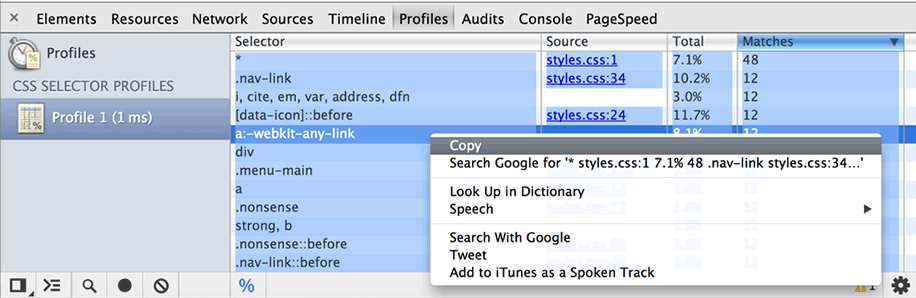
Chrome can tell you which rules in your stylesheets are actually being applied. Browse to any site you like. Open the Dev Tools. Now switch to the Profiles panel. Select the ‘Collect CSS Selector Profile’ option.
Now click the Start button from the bottom of the interface (a circle). The circle will go red to indicate that a recording has started.
Chrome is now recording the actions we take and counting how many times a selector used in our stylesheet is matched and how long it took to match. The best part is that it isn’t limited to a single page. Click around a site whilst Chrome records in this manner and try to invoke every style. Activate buttons, make hover styles appear and when you feel you have viewed all pages, click the stop/record button again. Don’t worry if you screw it up. Just select the profile on the left and click ‘Clear all profiles’ button (the one next to record). Then start again. Once you have a profile recorded, select it over on the left:
You’ll be presented by a four column table. The columns:
- Selector – the CSS selector in question
- Source – where the rule originated (handy if multiple stylesheets are being loaded)
- Total – how long did it take, in percentage terms to select this element
- Matches – how many times was the selector matched during the profile recording
With this data, we’re typically looking to find low-hanging fruit. For example, rules in our stylesheets that simply aren’t being employed. I term this ‘Rule Rot’ simply because they are generally more prevalent on older sites where refactors have taken place and unneeded styles have not been removed.
To look for possible rule rot, if you click the Matches column it will sort the results by that column. Take a look at the rules that have no matches and crucially reside in your authored stylesheets. Are these rules intentional? Are they old rules that are no longer needed? If so, you now know where they are (the source column provides the line number). Don’t forget however that this information is only based upon the styles that were used (or not) whilst the profile in question was being recorded so ensure you haven’t forgotten to visit an important page or section so that the required styles were triggered (for safety, before starting a large refactor, I tend to run 3 or more profiles to be sure).
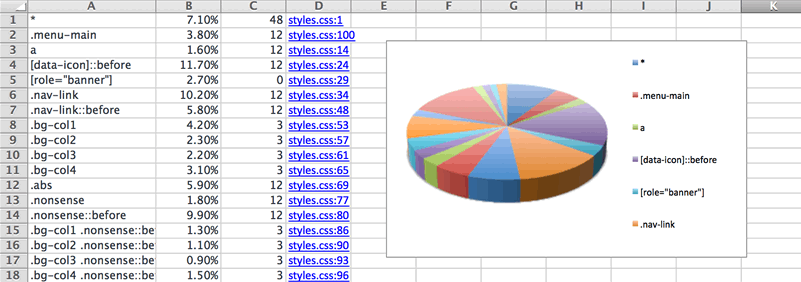
Export to Excel
Pro Tip: within the Profile window, select all the contents (e.g. command+A on the Mac) and copy them.
Now open Excel (or spreadsheet program of choice) and paste the contents in. You can now prettify this, show it and share it with colleagues or, if you really have nothing better to do, go crazy and make a chart or one of those pivot things I don’t understand.
Testing the performance of your styles
There are long held beliefs when it comes to CSS performance. However, whilst many hold true, they may not be true or be of negligible importance on YOUR site. Remember, the reason to use these tools is to replace conjecture with data. With said data it’s then possible to take action relevant to your site. Choices can then be made on empirical facts and not generalisations.
There are a number of tools available in the Chrome Developer Tools to test performance. For CSS performance, the two features I have found most useful are ‘Show paint rectangles’ and ‘Enable continuous page repainting’.
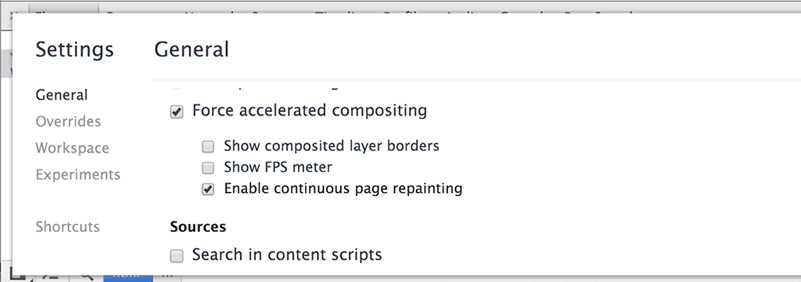
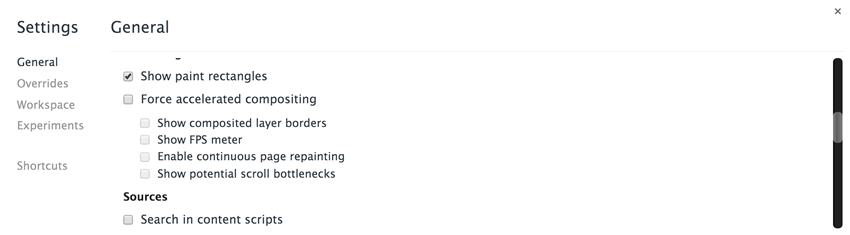
chrome://flags and press enter. Now scroll down the page until you see ‘Enable Developer Tools experiments’ (or command+F and search for it) and enable it. Now restart Chrome.Continuous page repainting
Click the cog at the bottom right of the Developer Tools window and under the General section, enable ‘Continuous page repainting’:
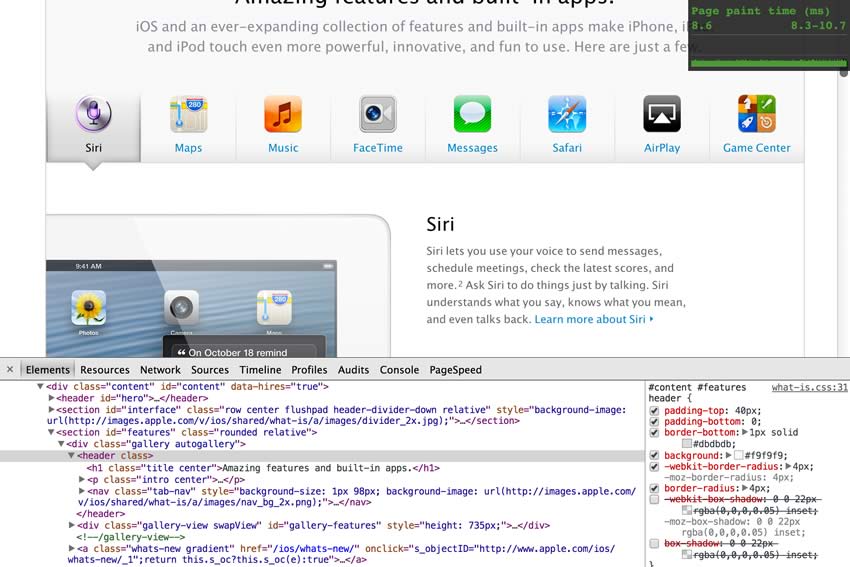
You’ll now see a tiny graph at the top right. It’s showing you how long, in milliseconds, it takes Chrome to paint the the current viewport (decrease the page width and the paint time typically reduces as there is less to paint). At the bottom is a graph showing previous paints. The line above indicates a 16ms threshold. Typically, something on desktop that has a paint time that exceeds 16ms could struggle on lower powered devices (e.g. mobile). 16ms isn’t an arbitrary number either. On a 60Hz screen (which includes many common devices but certainly not all), 16ms is the time available between refreshes of the screen to complete a frame. Therefore, the aim of this game is to reduce the paint time to get things below this threshold. ‘Expensive’ styles can come from surprising places. Luckily it’s easy to toggle styles and properties in the styles panel, or visually hide an element entirely by selecting it in the Elements area and pressing ‘H’. This way you can weed out suspects and deal with them accordingly.
Example: http://www.apple.com/iphone/ios/ – scroll down to this section:
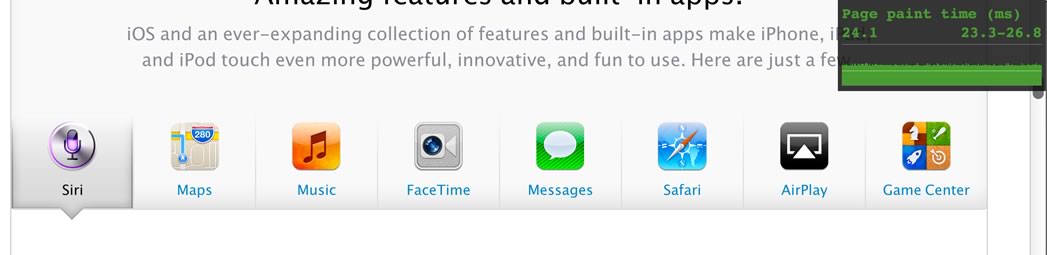
That’s a pretty high paint time. But what’s causing it? All those images? Fancy text? Nope, turns out that it’s an inset box-shadow style. Try for yourself. Select the relevant <header></header> and toggle the two box-shadow styles (it’s a vendor stack so one is a prefixed version of the same rule). Removing those properties and values makes little difference to the visuals but an enormous difference to the paint time of this element. There’s a box shadow style there too. Removing either one drops the paint time considerably so there’s clearly a high cost to having both styles on there at once.
Remember, this doesn’t mean you have to remove such effects (but come on, gradients are about as cool as flares right now – or are they cool again and I missed the memo?). However, such tests gives you some data on which to make some choices. Your choices.
Again, for the people at the back in the cheap seats – note: this is just Chrome. Other browsers may be better/worse at similar painting jobs.
Show paint rectangles
A related feature to ‘Enable continuous page repainting’ is ‘Show paint rectangles’. With this enabled, Chrome gives a visual indication of which areas of a page are being repainted as you interact with it. Here is how you enable it:
In browser terms, the ‘painting’ means what you expect. As the browser interprets the various data (e.g. HTML, CSS, JS) it composites the design to the screen as a series of ‘tiles’. If nothing changes, visually, as you interact with a page, there are likely few page repaints. This results in better performance as the browser isn’t having to perform re-calculations constantly. Let’s look at an example: http://store.apple.com/us
With paint rectangles enabled scroll up and down the page. You’ll see red rectangles flashing in certain areas as you scroll up and down but not in others. These are the areas that are being repainted by Chrome each time the page is scrolled.
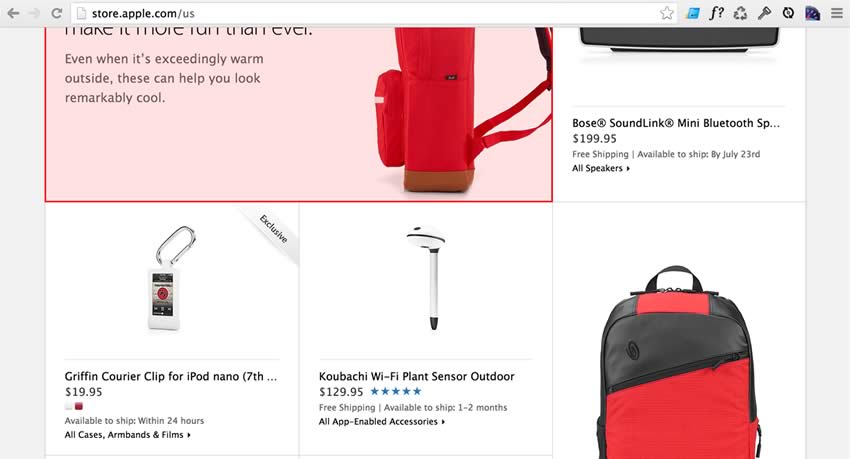
As with the continuous page repainting mode, it’s then possible to switch off properties relevant to that element. In this instance, it’s a style being applied on hover, perhaps not a problem in itself but this also occurs as the page is scrolled and perhaps those hover states are unneeded. This is a very common scenario and there are some easy to implement workarounds if it’s a problem for your page/application. Here’s a great post on paint times by Paul Lewis of Google over at HTML5 Rocks.
Resource bloat and asset encoding
The Chrome Developer Tools can tell you quickly and easily what assets (scripts, stylesheets, images) a page is loading; how many separate requests (number of files downloaded) a page is making and the total file size of said requests. Let’s have a look at another Apple page: http://www.apple.com/ipad/
With the Developer Tools open, switch to the Network panel. Now refresh the page. You’ll now see a long list of all assets that page is loading. Scroll to the bottom and you’ll see the totals in a grey bar. In this instance: 133 requests ❘ 4.4 MB transferred ❘ 5.06 s (load: 1.79 s, DOMContentLoaded: 1.37 s).
You can use the column headers to sort the assets and key for us is ‘Type’ as this allows us to look at all the CSS files. Could the files be combined to minimise the number of requests (for stylesheets, if using Sass this is obviously trivial)? Could smaller image assets be converted into SVGs for resolution independence? And embedded into the stylesheets as Data URIs (use Compass alongside Sass for easy conversion)?
Furthermore, you can also check if the assets you are using are being served ‘gzipped’ (Gzip is just the server equivalent of Zip’ing a file. It compresses the asset for smaller data size ‘over the wire’ and the browser automatically deflates it on receipt). Command/right-click the headers area and tick the ‘Content-Encoding’ option. This additional column will indicate which of the assets were sent gzipped. If none are, it’s time to look at how you can make that happen. Most servers use Apache to serve files and the HTML5 Boilerplate project has a great .htaccess file that typically makes gzipping happen automagically.
If you’ve never used the Dev Tools before to look at the performance of your CSS/Sass, hopefully, those features will give you some ideas about what you can achieve.
If that’s CSS performance, what about CSS quality? Chrome can help here too and we’ll also take a look at CSS Lint, a (sometimes maligned) tool that can automate CSS quality control to a degree.
CSS Errors in Chrome
In Chrome Developer Tools, switch to the Console tab. Here you will see any errors and warnings that Chrome has for the page. If you just want to see CSS errors, click the Filter button and un-tick anything other than CSS:
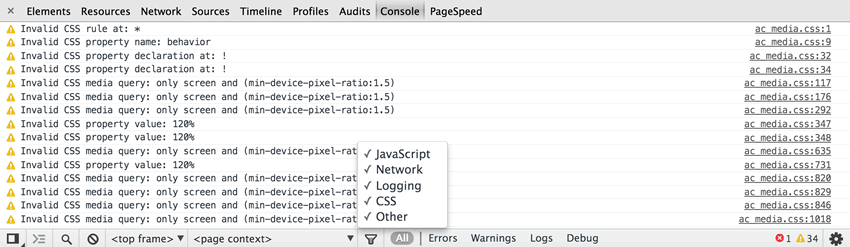
You’ll now see any CSS rules that Chrome deems ‘invalid’. These can’t be taken ‘as read’. Some may be vendor prefixed rules that apply to other browser vendors and others may be there for a specific reason you know about but it’s a handy way to catch common mistakes. As an example, I have a bad habit of writing ‘font’ instead of ‘font-family’ and this feature of the Chrome Developer Tools catches me when I drop the ball.
CSS Lint (note: nothing to do with Chrome)
Whilst we are on the subject of CSS code quality, I think it’s worth mentioning CSS Lint. It’s a configurable tool that let’s you specify the CSS faux pas you are looking for. Paste your CSS into the big empty box and then click the big down arrow:
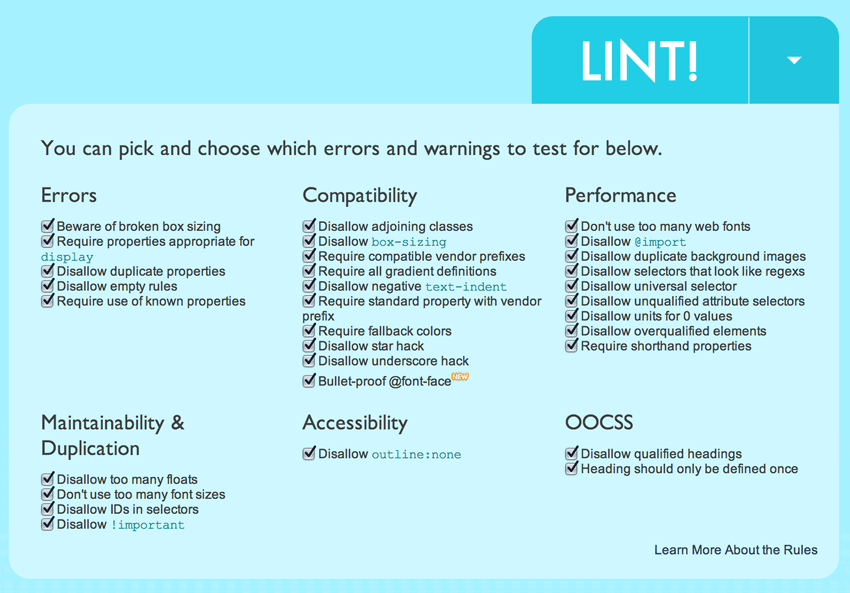
There are plenty of options enabled by default I don’t consider a problem. But remember, these are your style sheets so take a look what it’s checking. Also be aware that many text editors have plugins for this. Sublime users will want to check out https://github.com/SublimeLinter/SublimeLinter.
Typical examples of the kind of problems it can spot are declaring a float alongside display: inline-block; – which will have no affect. Conversely I don’t give a monkeys about ‘Avoiding un-anchored hovers’ (generally only affects IE7 badly) so I un-tick that before linting. Like the Chrome Developer Tools console errors, CSS Lint is generally worth using before pushing styles into production rather than throughout the iteration stage. A final sanity check before going live.
Chrome Developer Tools Voodoo
Perhaps the most innovative and time saving feature of the Chrome Developer Tools of late is the ability to save amends made in the developer tools back to the source files. This prevents round-trips to the editor. See a problem or need to change a style? Simply Command-click a property or value and the relevant file opens in the Sources tab. Now edit the value and press command+S and the file is saved and the change reloaded straight into the browser. No need to head back to your text editor! At present, the setup of this is relatively long winded but I have an exhaustive post covering how this can be set up. Interested parties should head here: http://benfra.in/1z1.
Conclusion
If you’ve never looked at this sort of testing before, well done for reading this far. We’ve covered a lot of ground.
I hope it’s given you a little insight into how you can use the Chrome Developer Tools to get real data about your stylesheets and make them leaner and more performant.